Validated ACV
$100K
Deel contract today. Single customer, expanding.

May 2026


Cost to serve down 42%. Analyst time down 6x.
AI confidence scoring replaces most manual review. The analyst is a temporary validation layer.
Demand validated at $100–150K ACV. Market is early; direct sales won't convert on our timeline.
Key prospects cut headcount weeks after engagement.
Hiring fraud dropped on the priority stack.
CISO + HR must both approve. 12–18 month cycles.
Enterprise sales is a muscle we're building. Pipeline is strong; converting at this rate has been on us.
On their roadmap 1–2 years out.

 Red Violet
+ Tier 1 BGC
Red Violet
+ Tier 1 BGC
Already competing with us in RFPs.

 Incode

Expanding from workforce identity into hiring moments.
 Silverfort
+ identity-first security
Silverfort
+ identity-first security
A new CISO budget line on top of the HR relationship they already own.
IDV is commoditizing. They need to move upstream to the CISO. Clarity is what they're trying to build.
A map of the strategic conversations we want to open.
+ Tier 1 BGC
Incode
Sumsub
Maintain $350K/mo. The team and product are the assets being acquired.
2–3 months, focused on BGC → IDV → Cybersecurity. M&A is the better shareholder outcome.
Open doors. We need warm introductions to Tier 1 BGC, IDV, and Cybersecurity players through your networks. Michael will share the target list at the meeting.
Next board meeting is a go/no-go. Clear path with a partner, or we reconvene on all options.
The buyer exists. The cycle is too slow for us to fund alone. It is the right speed for a distributor with an installed base.
Clarity isn't a feature an acquirer adds. It's a second product line, sold to a different buyer and paid for out of a different budget, that runs on the customer relationships the acquirer already has.
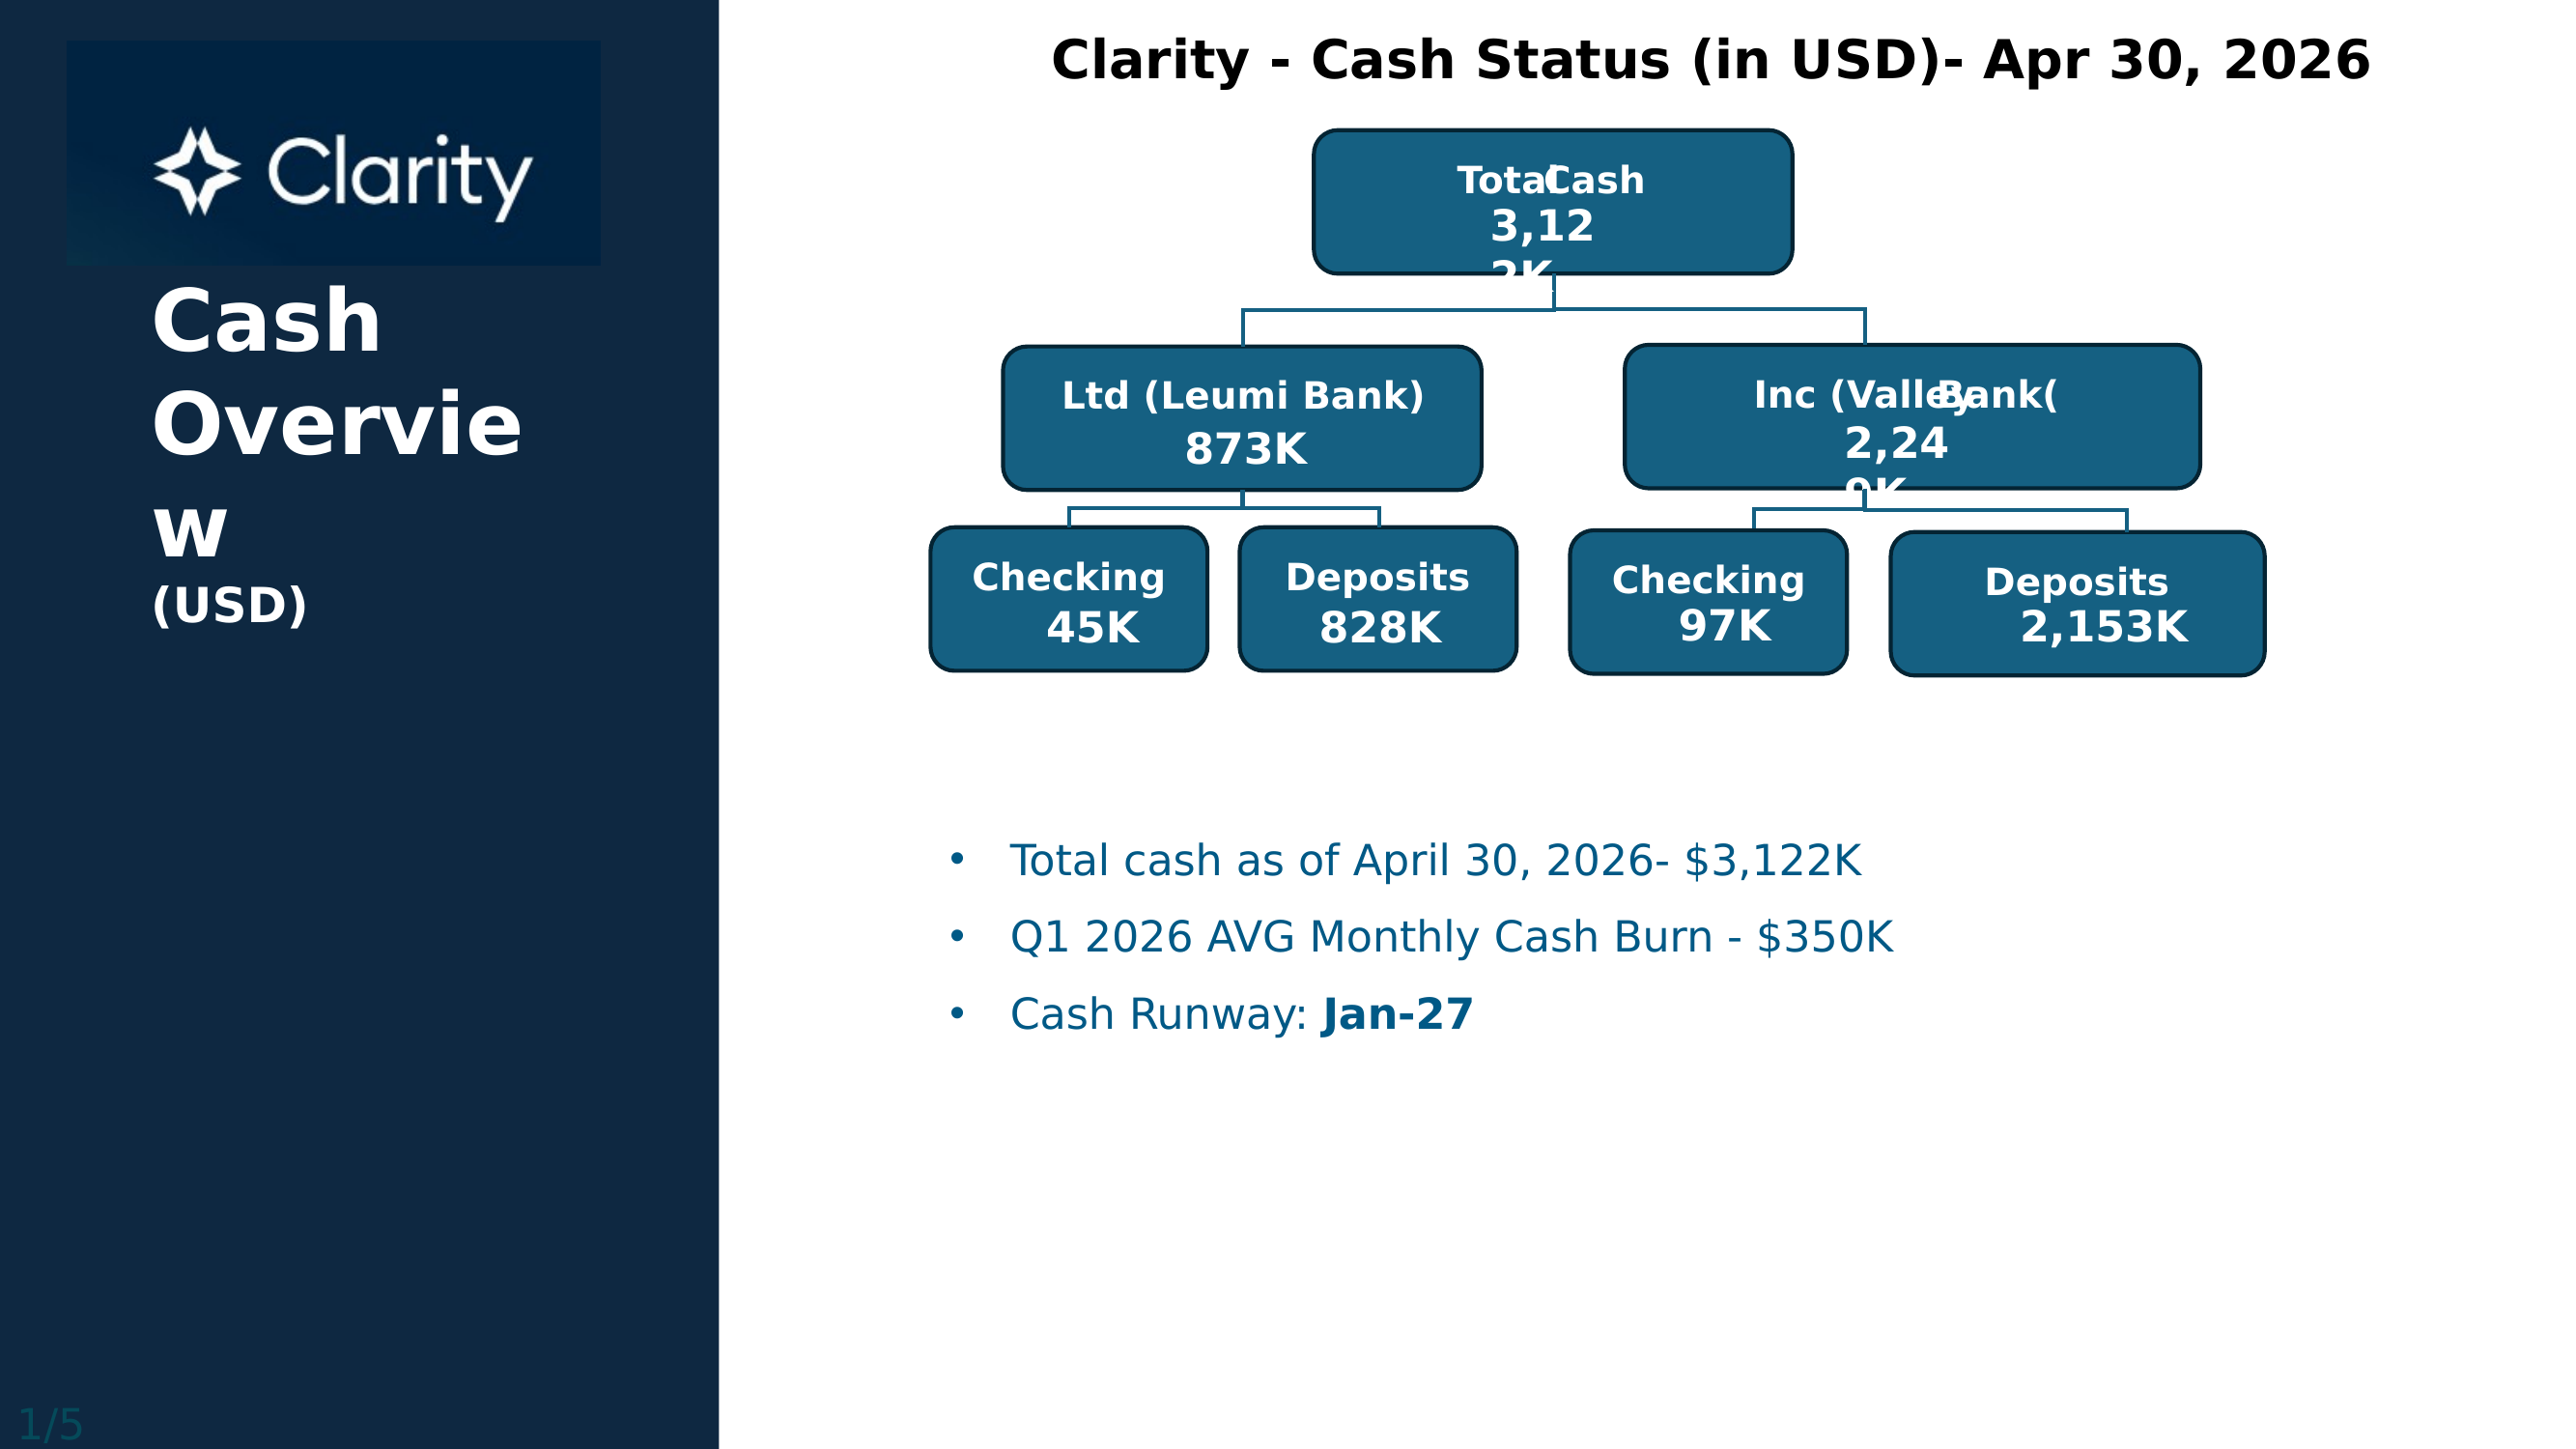
Detailed cash position, burn, and runway. Source: Clarity CFO close, April 30 2026.
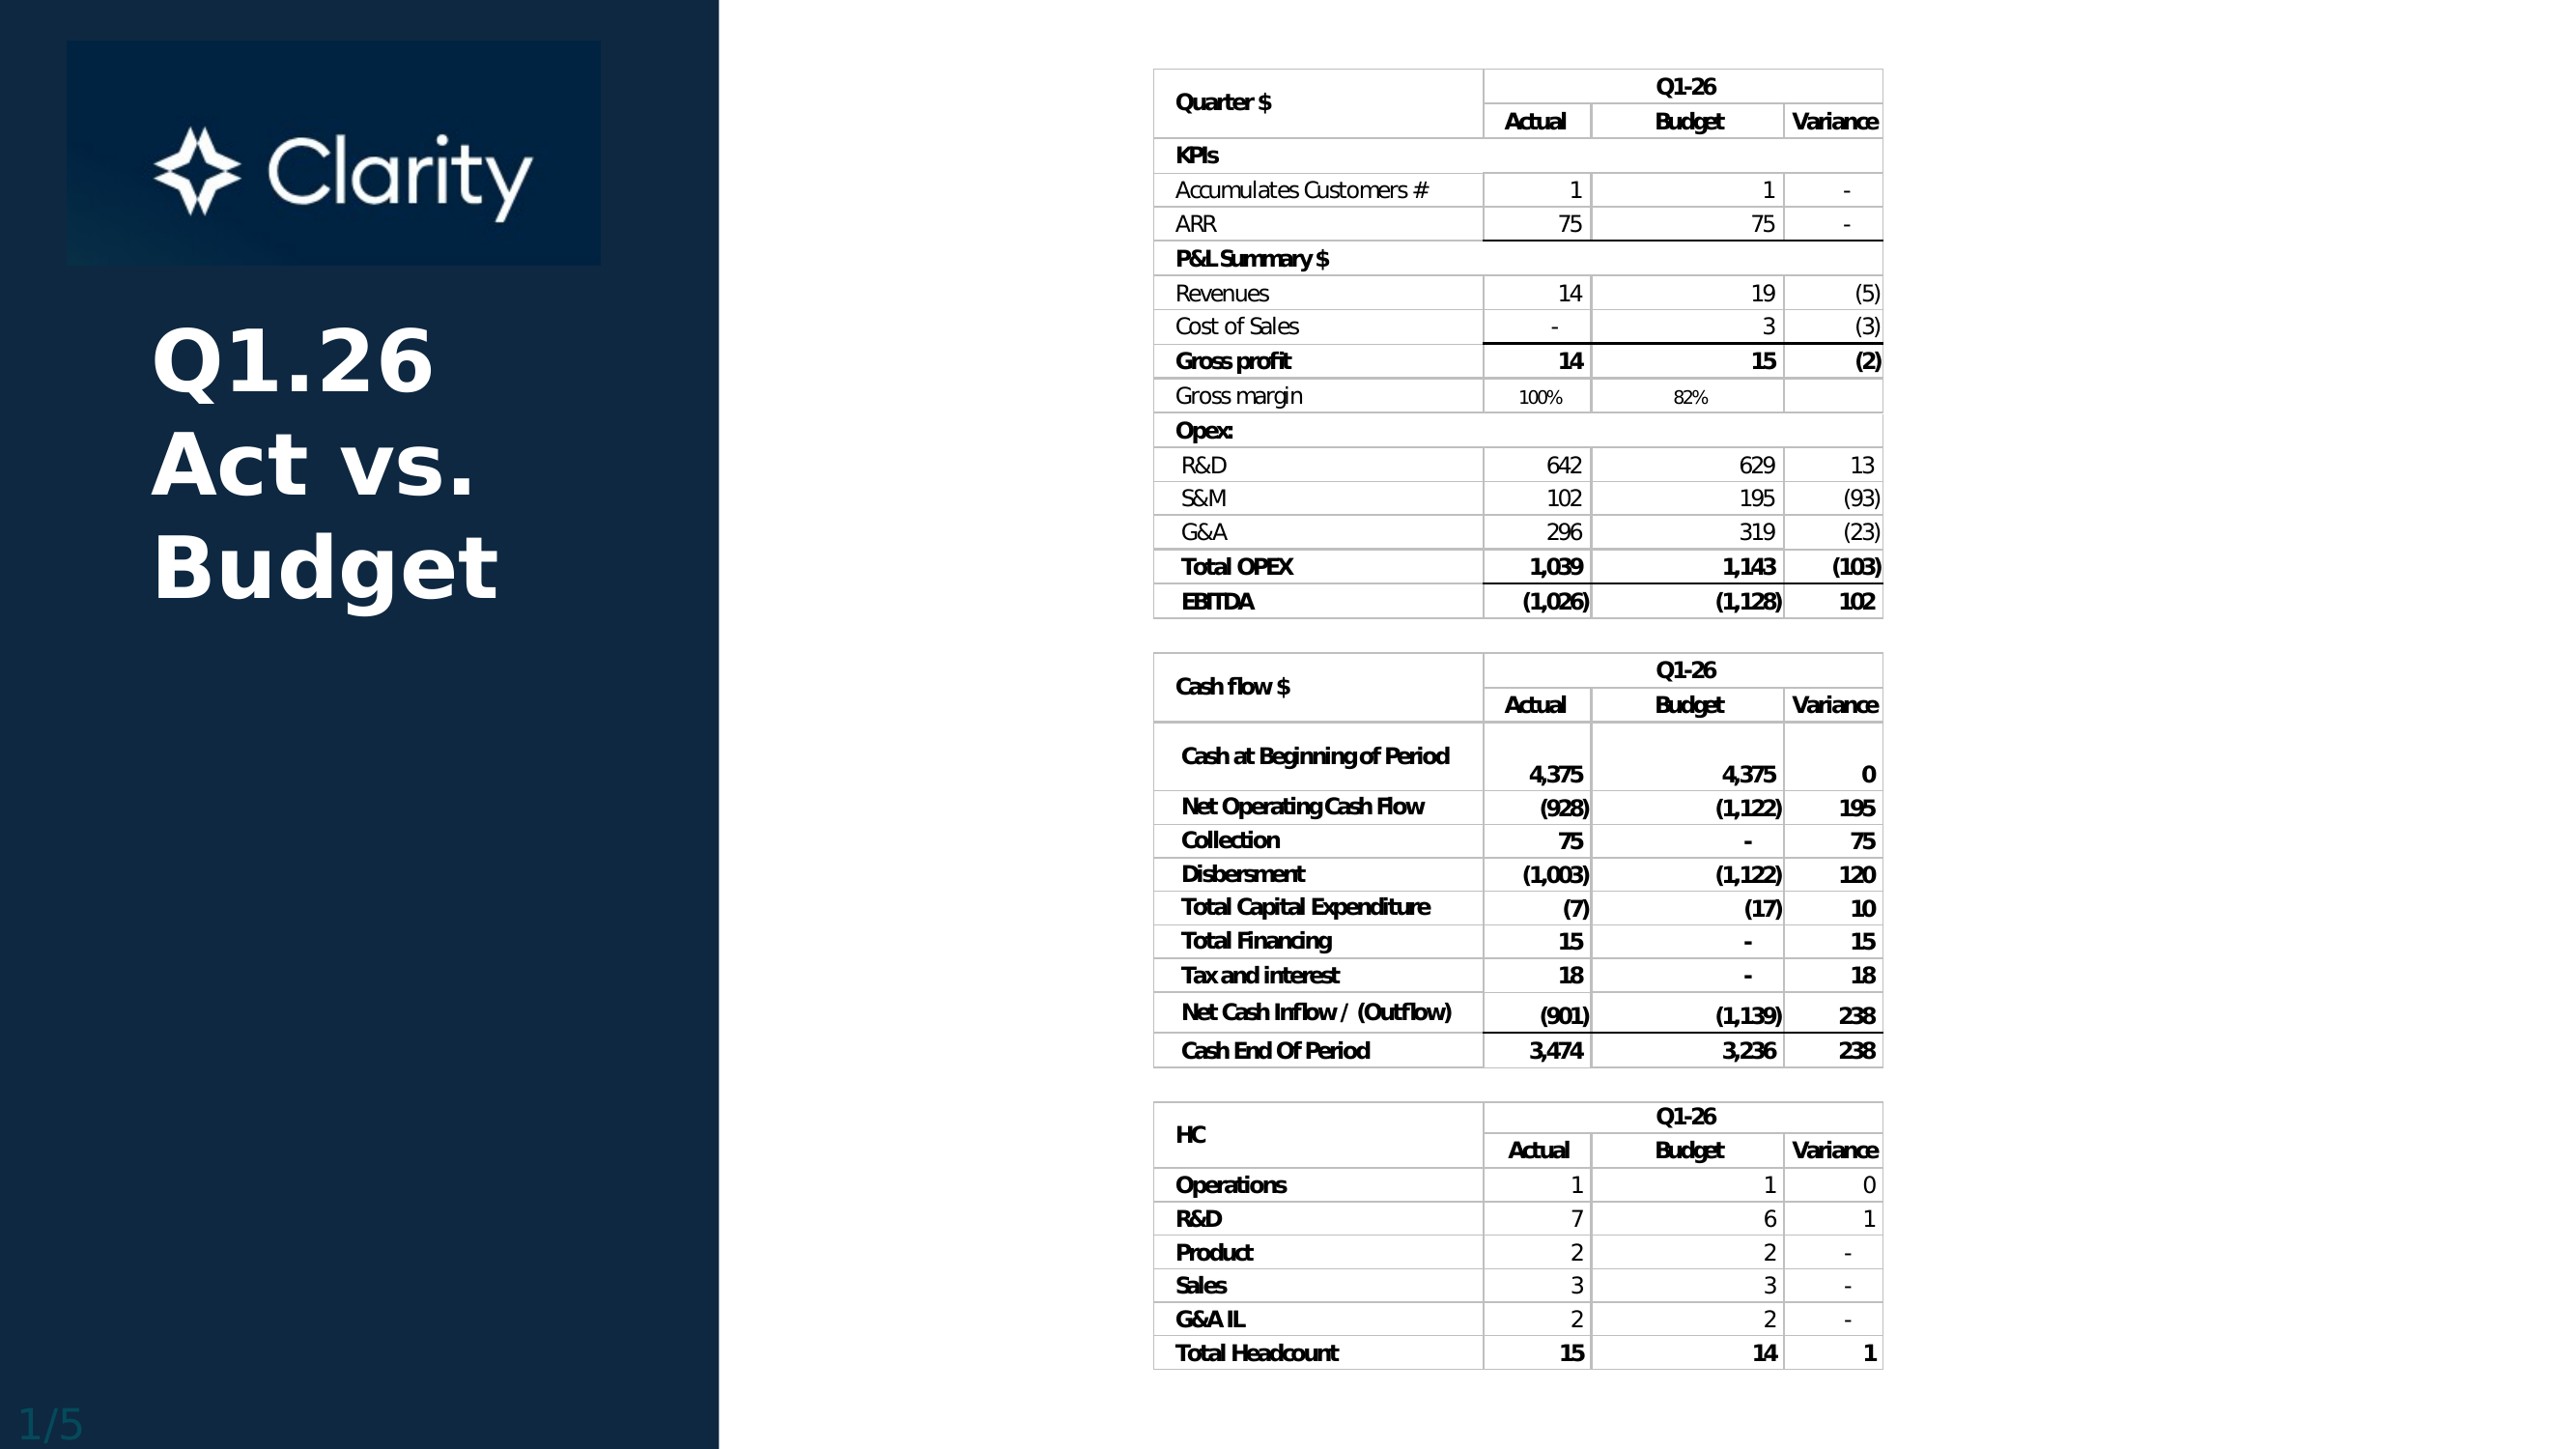
| P&L line | Actual | Budget | Variance |
|---|---|---|---|
| Revenue | |||
| Revenue | $13.5K | $18.8K | −$5.2K |
| Cost of sales | $0K | $3.4K | −$3.4K |
| Gross profit | $13.5K | $15.3K | −$1.8K |
| Gross margin | 100% | 81.8% | +18.2pp |
| Operating expense | |||
| R&D | $641.6K | $628.9K | +$12.6K |
| S&M | $102.0K | $194.7K | −$92.7K |
| G&A | $295.9K | $319.2K | −$23.3K |
| Total OPEX | $1,039K | $1,143K | −$103K |
| EBITDA | −$1,026K | −$1,128K | +$102K favorable |
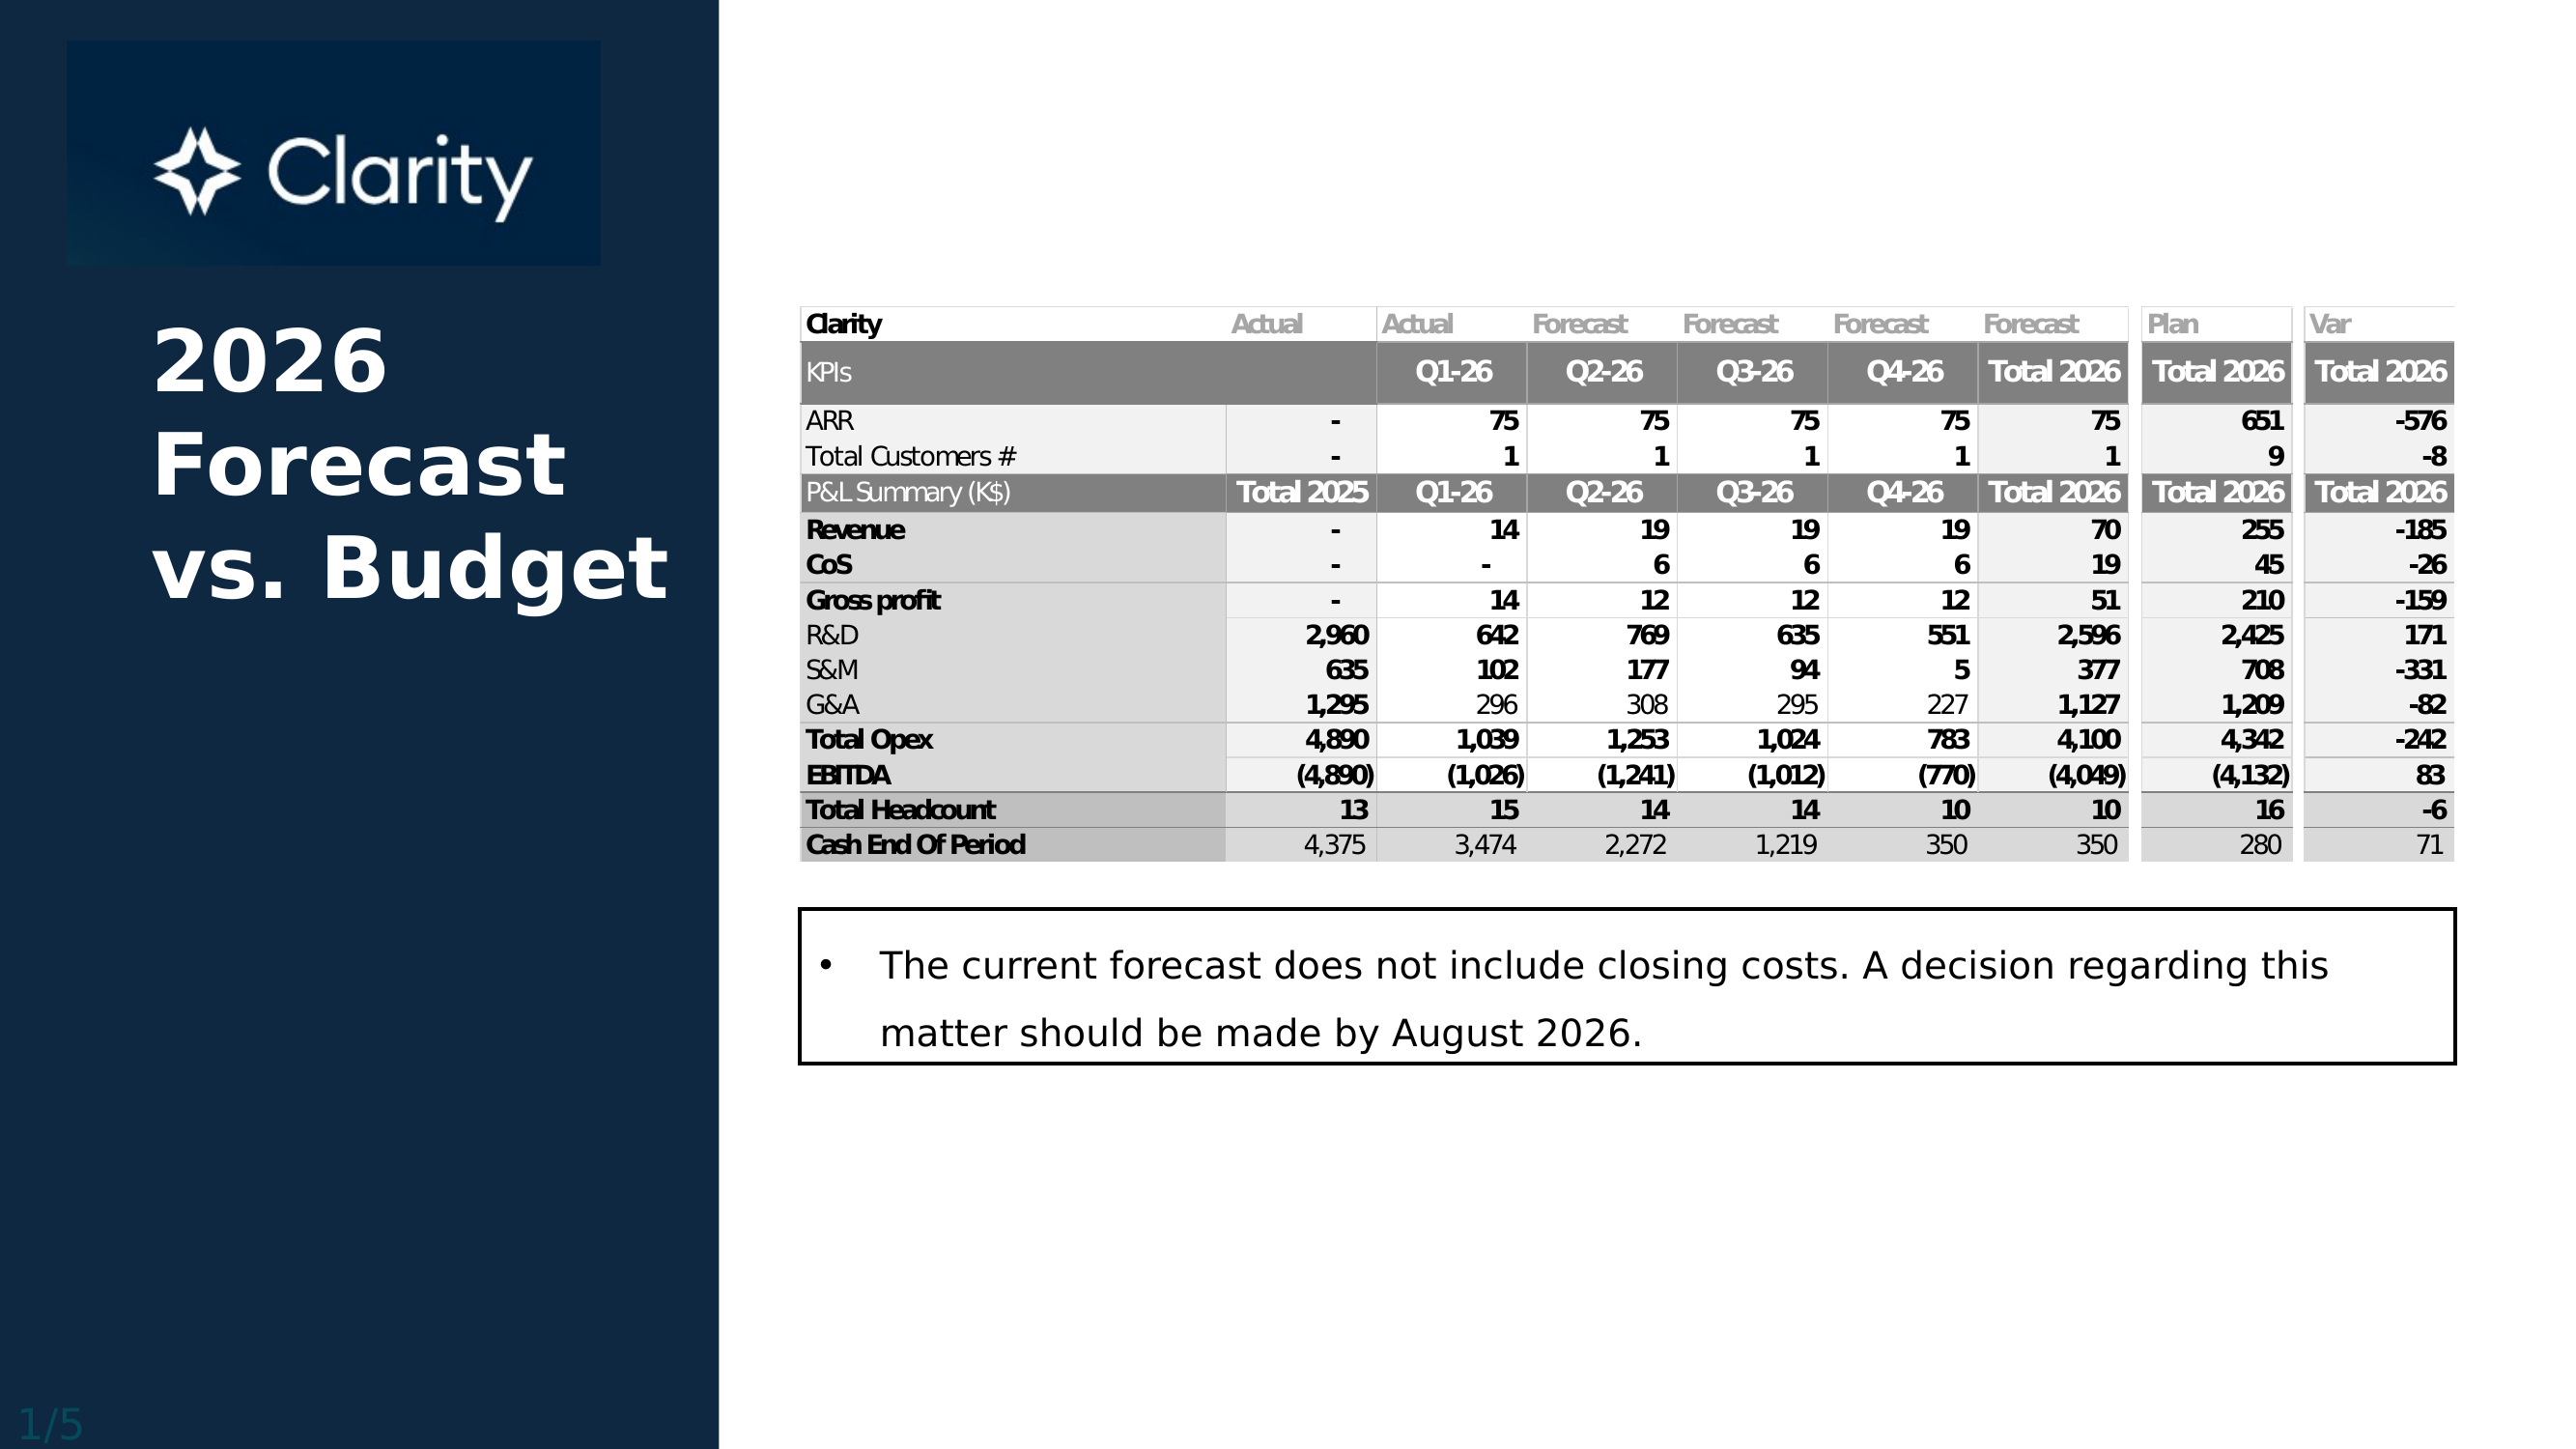
| P&L line · FY26 | Forecast | Budget | Variance |
|---|---|---|---|
| Revenue | |||
| Revenue | $69.8K | $255.0K | −$185.2K |
| Cost of sales | $18.9K | $44.7K | −$25.7K |
| Gross profit | $50.9K | $210.4K | −$159.5K |
| Gross margin | 72.9% | 82.5% | −9.6pp |
| Operating expense | |||
| R&D | $2,596K | $2,425K | +$171K |
| S&M | $377K | $708K | −$331K |
| G&A | $1,127K | $1,209K | −$82K |
| Total OPEX | $4,100K | $4,342K | −$242K |
| EBITDA | −$4,049K | −$4,132K | +$83K favorable |
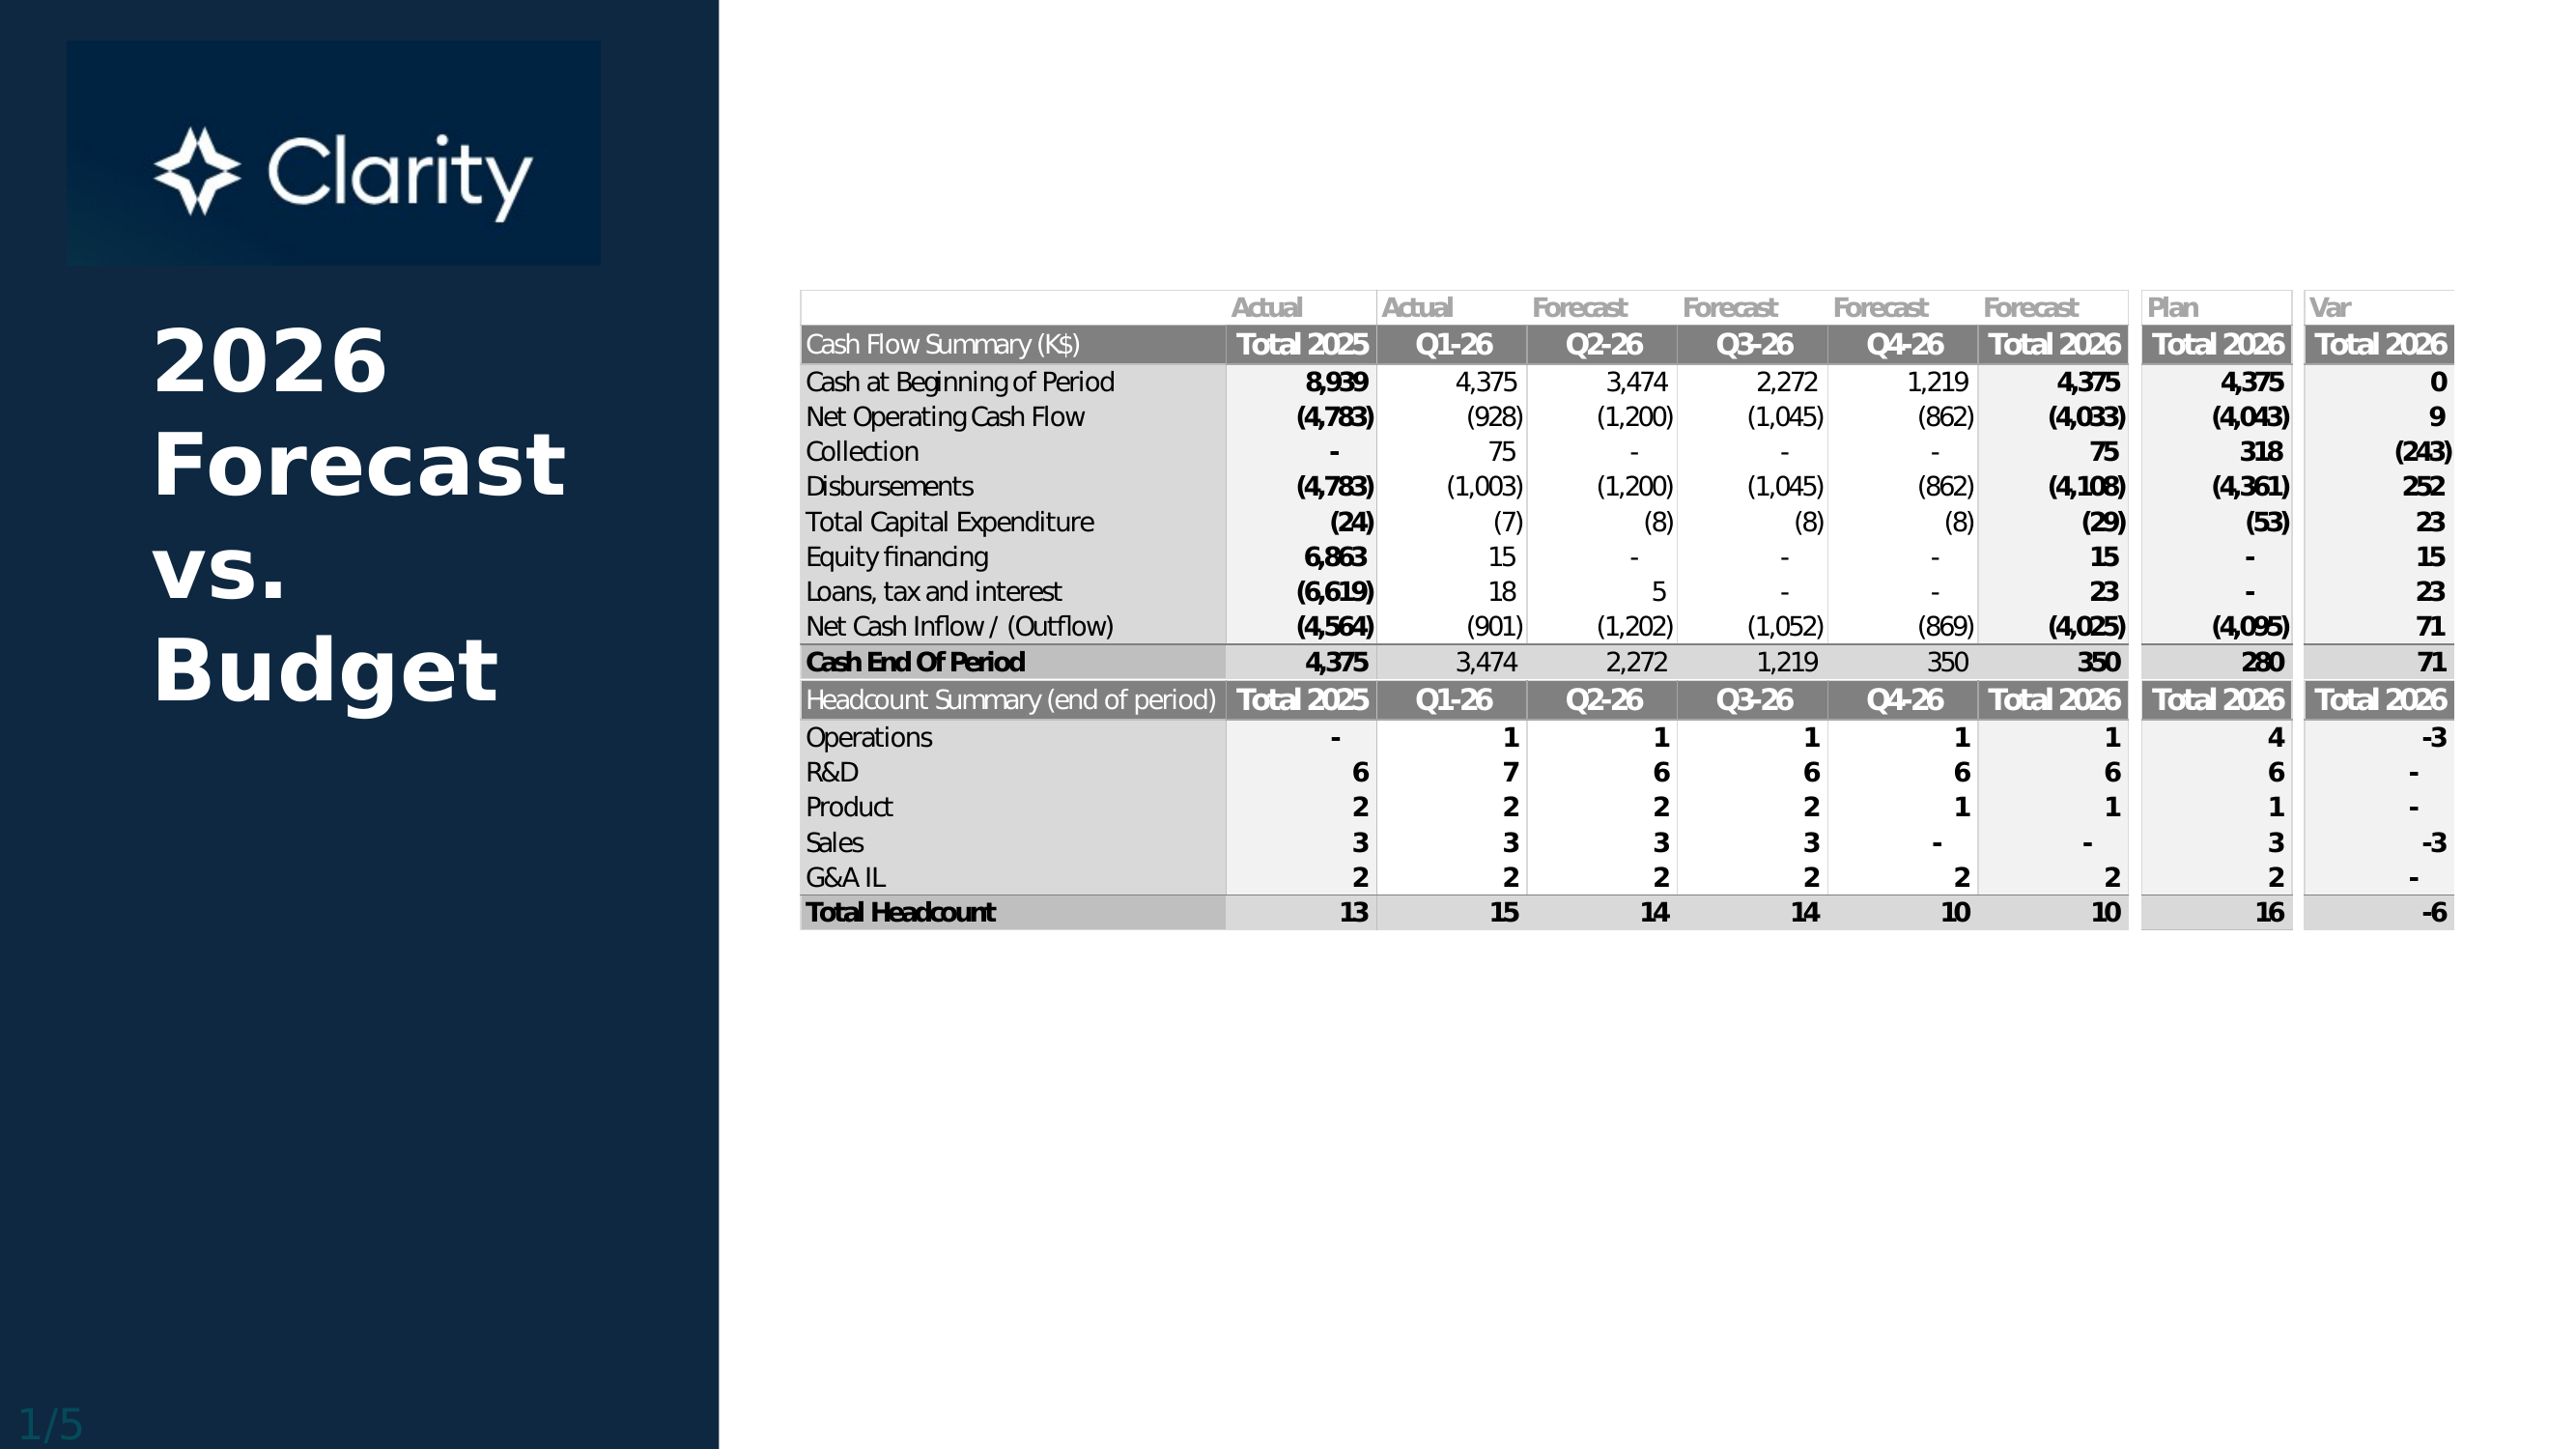
End-of-quarter cash balance, forecast vs. budget. Q1 is actual; Q2–Q4 are estimated at current burn.